Last Updated on 16th February 2021 6:43 PM by AfriWX
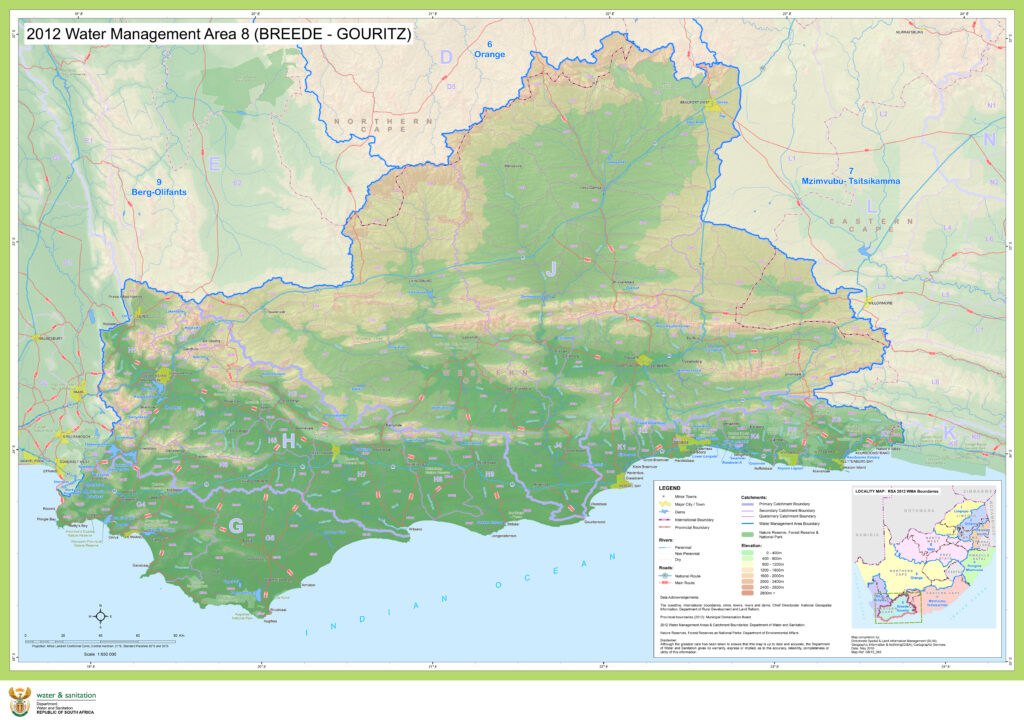
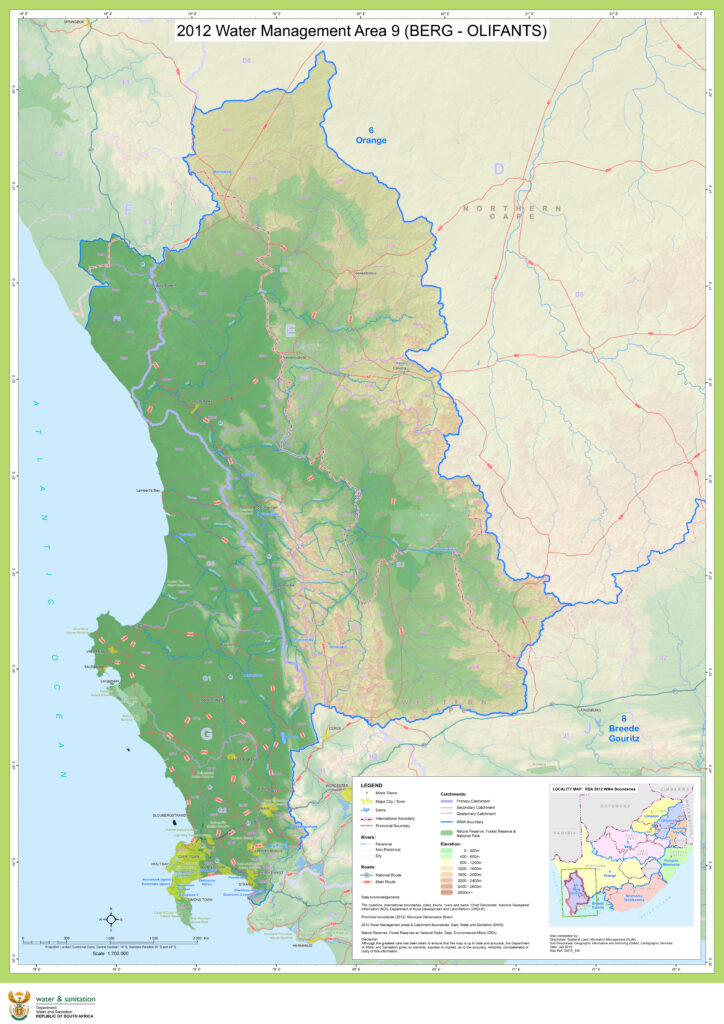
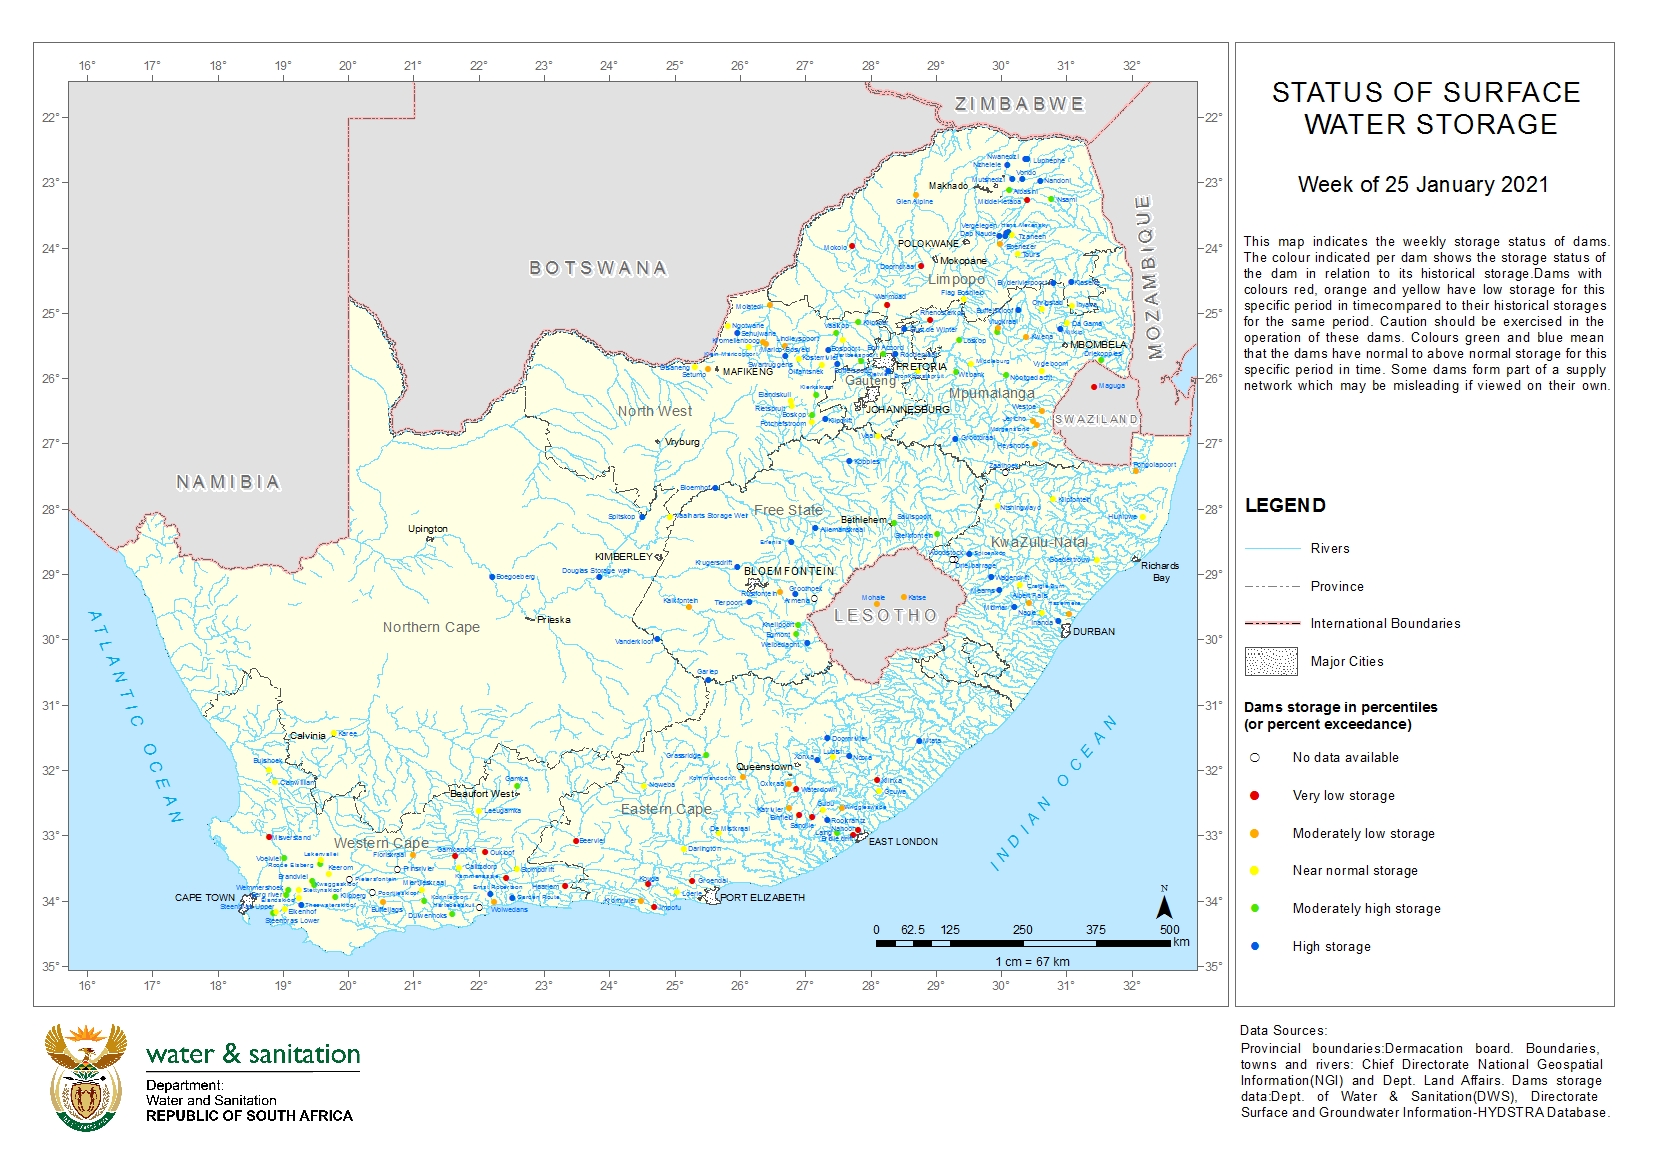
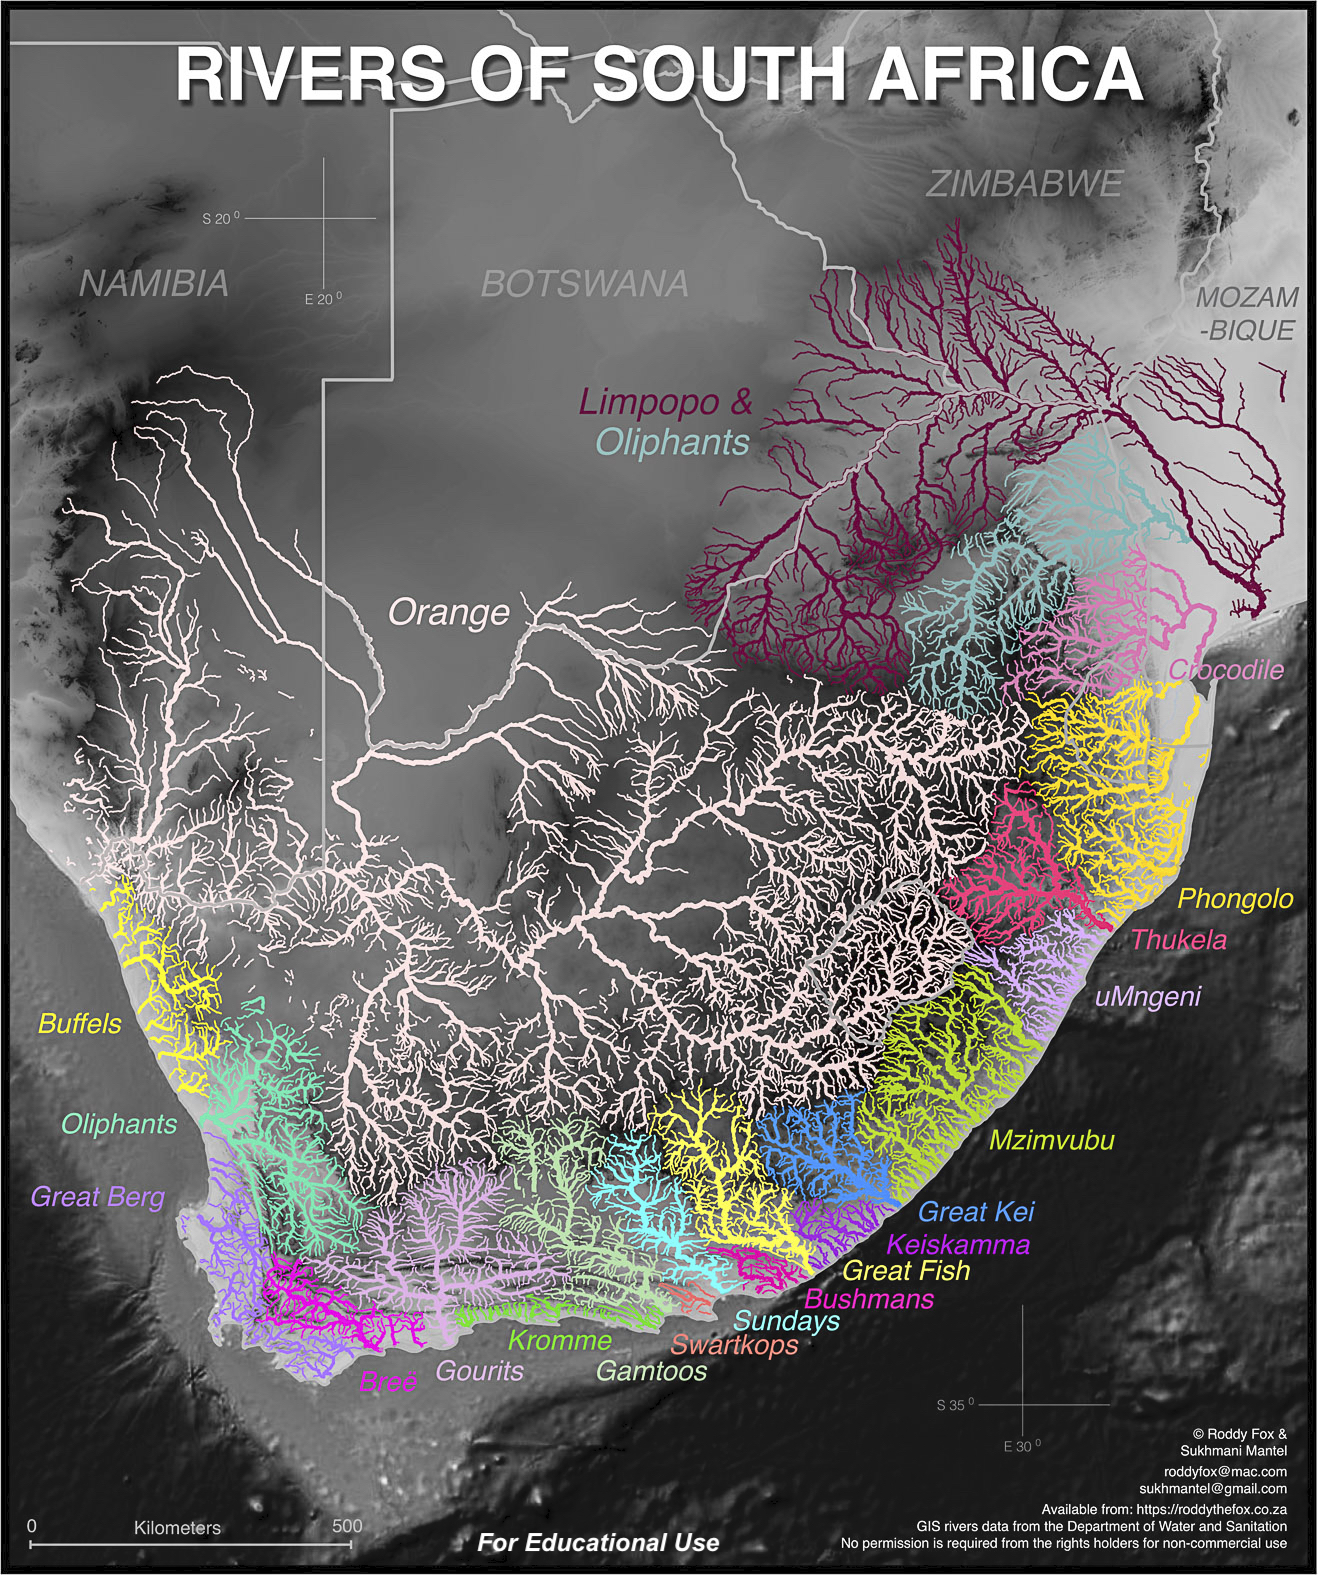
This page contains very high resolution images of the Water Management Areas of South Africa and the associated Rivers and Dams. These are unable to be posted on social media as their quality will get reduced substantially and they contain very fine details.
Herewith is some beautiful maps of our Dams and River Systems in South Africa. These are public documents.
Contributor – Gerhard Visser – Weather Today Southern Africa
[Source: Department of Water and Sanitation]Join the South African Rivers and Dams – Hydrology group on Facebook and Follow the Page.
Each Download Button Shows the File Size
All 10 maps amount to 472 Mb of Data Usage
Join our AfriWX Telegram Weather Group
Don’t forget to join the free AfriWX group on Telegram Messenger, please download Telegram for Android or iPhone if you want to always be up to date with the latest weather maps.
Click to join our Telegram Group
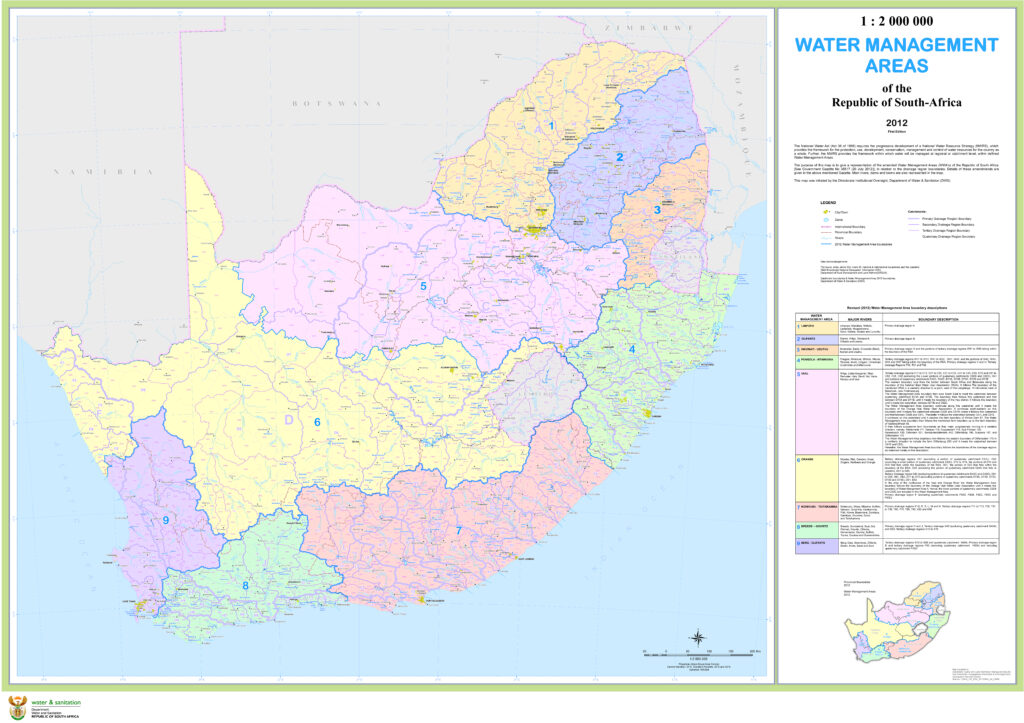
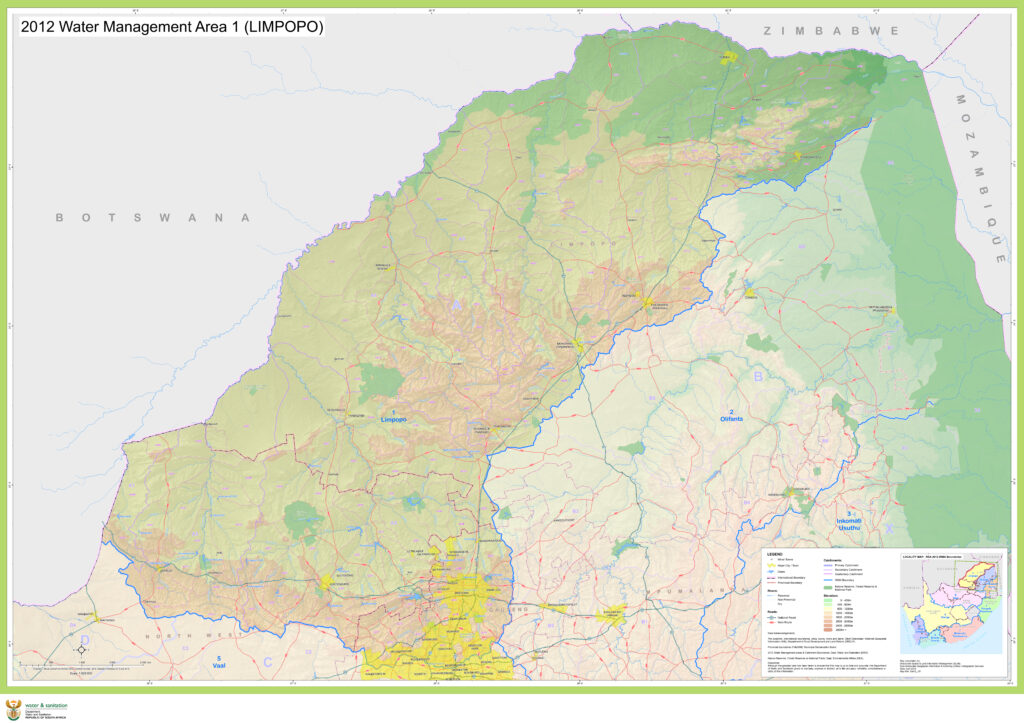
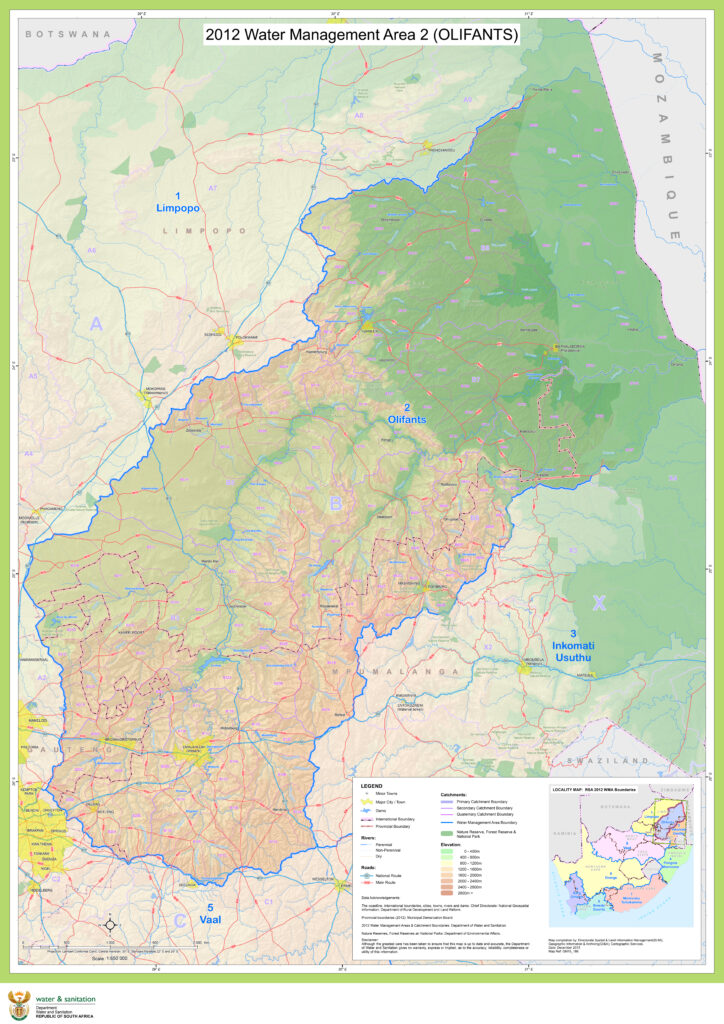
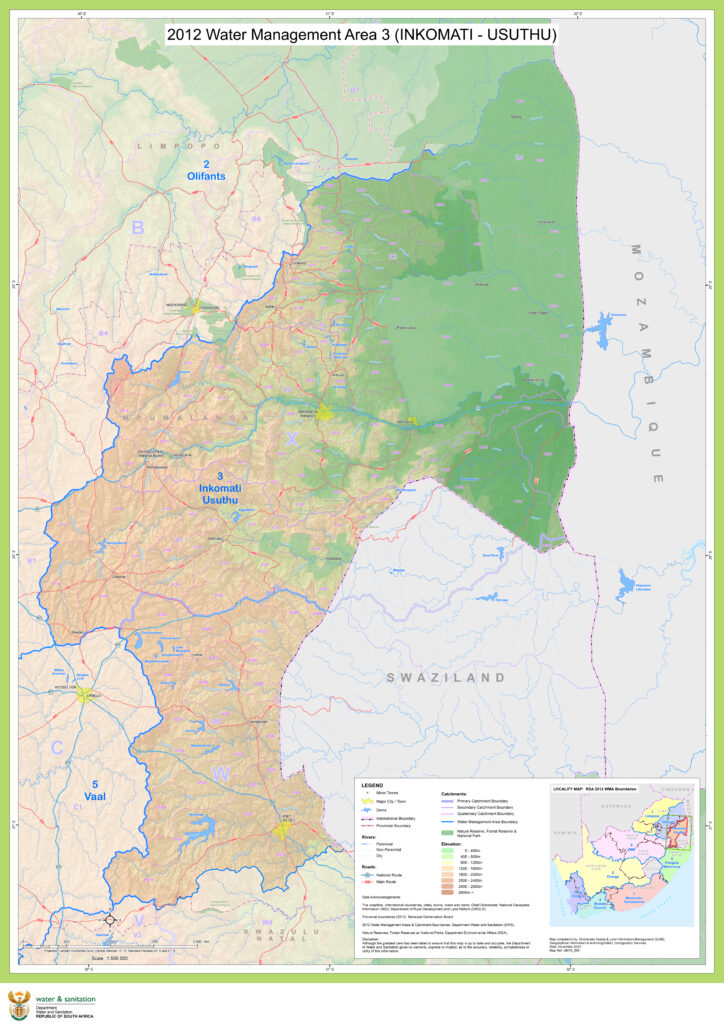
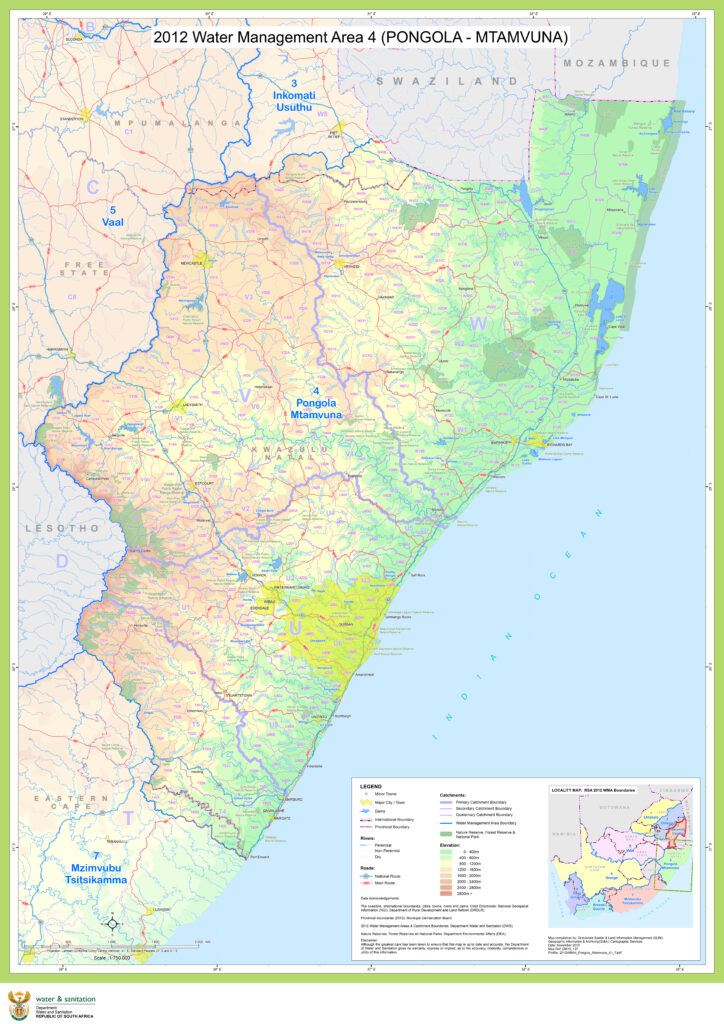
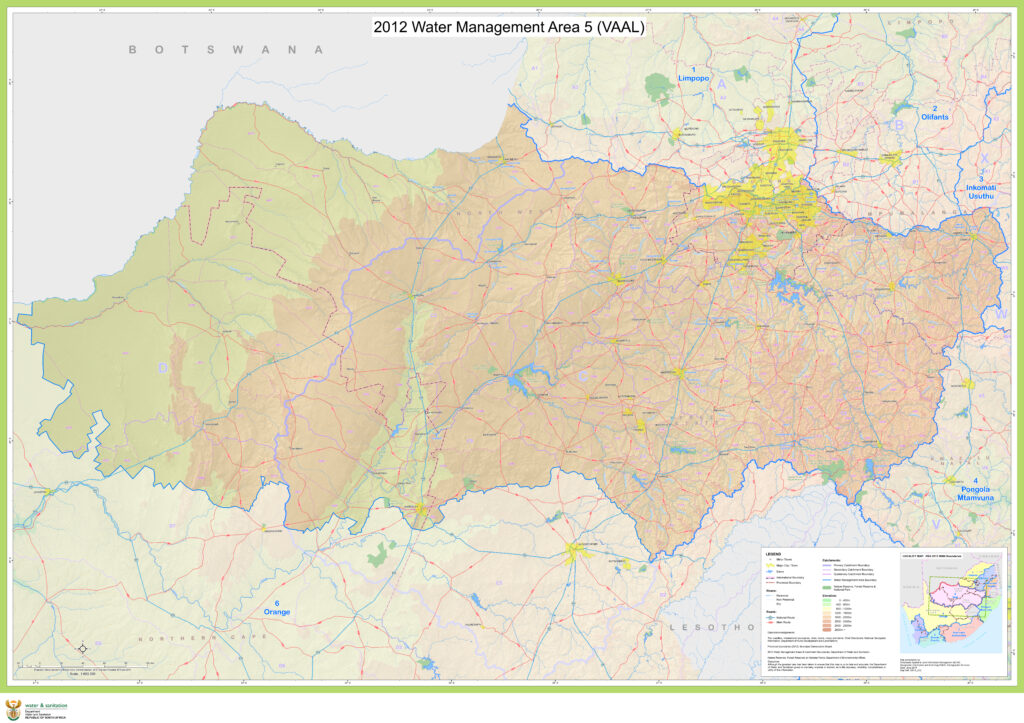
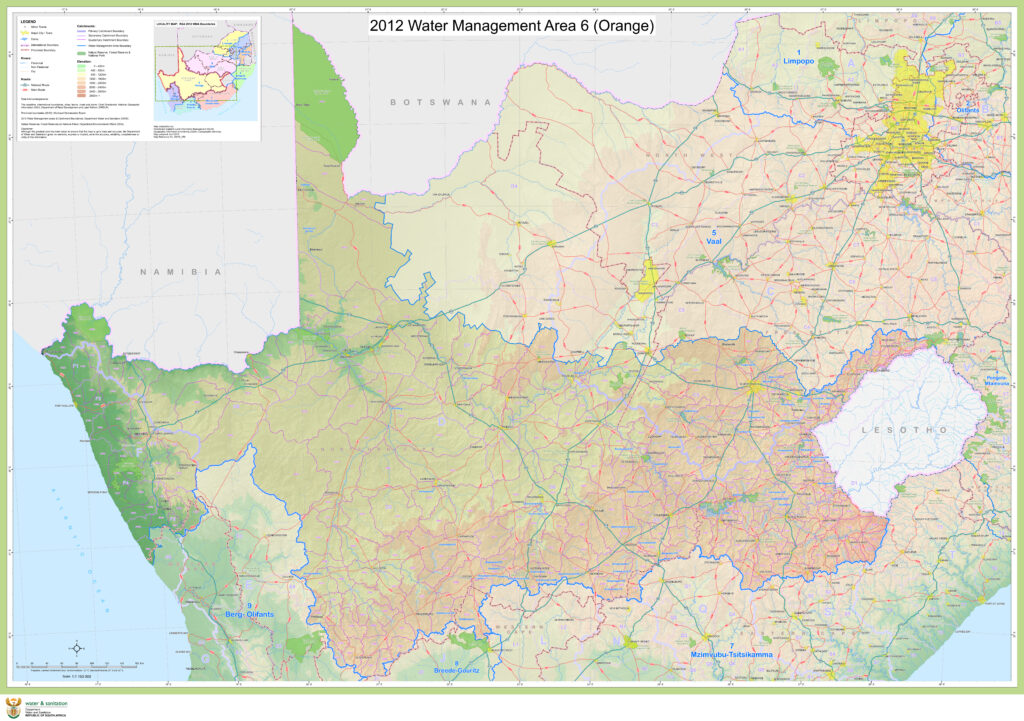
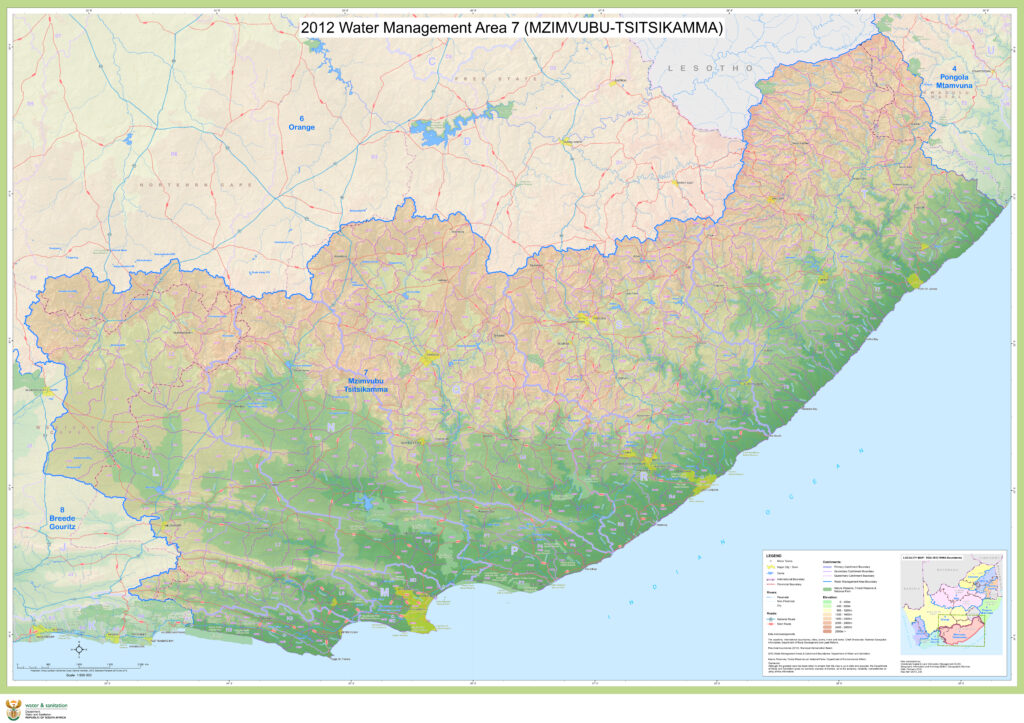
Status of Water Surface Storage
Rivers of South Africa Map
Latest Dam Levels in South Africa
30 Jan 21 – Dam Levels in South Africa
DWS Info – Compiled by Gerhard Visser
Gariep – 115.52%
Vanderkloof: 105.33%
Katse: 56.0% (25 Jan 21)
Kalkfontein: 61.6%
Tierpoort: 92.65%
Rustfontein: 31.6%
Krugersdrift: 115.45%
Sterkfontein: 96.31%
Vaaldam: 75.0%
Grootdraai: 102.65%
Allemanskraal: 99.85%
Erfenis: 108.44%
Bloemhof: 103.33%
Taung: 100.39%
Spitskop: 110.46%
Wentzel: 100.23%
Midmar: 100.77%
Inanda: 102.19%
Nagle: 91.58%
Albert Falls: 39.05%
Spioenkop: 103.67%
Ntshingwayo: 83.54%
Nooitgedacht: 93.05%
Vygeboom: 101.38%
Driekoppies: 90.01%
Klipkopjes: 44.07%
Primkop: 100.11%
Kwena: 49.6%
Inyaka: 65.8%
Witbank: 91.05%
Middelburg: 77.33%
Bronkhorstspruit: 90.86%
Rust der Winter: 100.86%
Loskop: 90.78%
Buffelskloof: 101.11%
De Hoop: 93.29%
Flag Boshiela: 80.41%
Blyderivierpoort: 102.51%
Ebenezer: 47.05%
Tzaneen: 42.49%
Mokolo: 39.7%
Albasini: 76.5%
Nandoni: 104.52%
Churchill: 50.94%
Kouga: 8.02%
Loerie: 69.23%
Groendal: 39.51%
Ngweba: 12.33%
Darlington: 36.32%
Grassridge: 65.04%
Laing: 101.03%
Nahoon: 28.9%
Lubisi: 87.73%
Waterdown: 22.74%
Ncora: 107.39%
Umtata: 103.05%
Wolwedans: 62.77%
Garden Route: 108.76%
Clanwilliam: 58.42%
Karee: 43.3%
Voelvlei: 77.05%
Bergrivier: 84.17%
Kwaggaskloof: 48.29%
Ceres: 86.1%
Eikenhof: 86.92%
Brandvlei: 49.74%
Theewaterskloof: 88.4%
Calitzdorp: 40.99%
Gamka: 61.49%
Gamkapoort: 0.34%
Leeu Gamka: 3.32%
Floriskraal: 11.19%
Stompdrift: 17.71%
Dam Levels in South Africa 1 February 2021
Gariep – 124.73% / Inflow: +- 3800m3/s / Outflow: 3086.92m3/s
Vanderkloof: 110.79% / Inflow: +- 3000m3/s / Outflow: 1904.45m3/s
Katse: 56.0% (25 Jan 21)
Kalkfontein: 63.6%
Tierpoort: 93.91%
Rustfontein: 31.76%
Krugersdrift: 104.85%
Sterkfontein: 96.59%
Vaaldam: 77.95% / Inflow: 533m3/s
Grootdraai: 102.88%
Allemanskraal: 99.85%
Erfenis: 108.44%
Bloemhof: 101.54% / Outflow: 99.64m3/s
Taung: 100.42%
Spitskop: 110.27%
Wentzel: 100.27%
Pongolapoort 40.3% (25 Jan 21)
Goedertrou 62.9% (25 Jan 21)
Midmar: 100.94%
Inanda: 102.06%
Nagle: 97.32%
Albert Falls: 41.06%
Spioenkop: 102.46%
Ntshingwayo: 84.34%
Hartebeespoort 94.1% (25 Jan 21)
Nooitgedacht: 105.62%
Vygeboom: 105.44%
Driekoppies: 92.61%
Klipkopjes: 46.31%
Primkop: 100.09%
Kwena: 53.05%
Inyaka: 68.23%
Witbank: 93.18%
Middelburg: 81.36%
Bronkhorstspruit: 91.32%
Rust der Winter: 100.94%
Loskop: 96.08%
Buffelskloof: 101.29%
De Hoop: 95.17%
Flag Boshiela: 80.18%
Blyderivierpoort: 104.35%
Ebenezer: 49.37%
Tzaneen: 44.93%
Mokolo: 39.7% (25 Jan 21)
Albasini: 77.0%
Nandoni: 103.51%
Churchill: 50.42%
Kouga: 8.0%
Loerie: 68.85%
Groendal: 39.33%
Ngweba: 12.07%
Darlington: 36.1%
Grassridge: 69.33%
Laing: 100.15%
Nahoon: 29.0%
Lubisi: 88.79%
Waterdown: 23.38%
Ncora: 103.14%
Umtata: 102.2%
Wolwedans: 62.55%
Garden Route: 108.58%
Clanwilliam: 57.33%
Karee: 42.66%
Voelvlei: 75.98%
Bergrivier: 83.53%
Kwaggaskloof: 47.81%
Ceres: 85.67%
Eikenhof: 86.28%
Brandvlei: 49.09%
Theewaterskloof: 88.45%
Calitzdorp: 40.88%
Gamka: 61.06%
Gamkapoort: 0.33%
Leeu Gamka: 2.79%
Floriskraal: 11.15%
Stompdrift: 17.64%
Roodefontein: 96.64%
